On May 1st, the Iowa Department of Revenue (IowaDOR) released sales and use tax statistics for the final quarter of 2018. Before discussing the new statistics, it should be stated that due to state legislation enacted last year and the U.S. Supreme Court’s South Dakota v Wayfair, Inc. decision, retail sales tax statistics for 2018 and 2019 are likely to be somewhat muddled. Store closures by major regional and national retailers, such as Toys-R-Us, Sears, and Younkers, further confuses the retail trade picture. The continued ascent of on-line retailing, long-term demographic trends, and regional economic factors make the interpretation of the retail trade data particularly challenging at this time. Nevertheless, here is a look at the statewide numbers.
Since enactment of the state’s sales tax in 1934 and the use tax in 1937 the IowaDOR has published quarterly and annual (fiscal year) compilations of statistics that identify the number of returns filed, taxable sales, and computed tax for each quarterly tax period statewide and by county. In addition, to the extent possible without revealing confidential information about individual businesses statistics are published in summary for twelve broad business groups. For many years the business group summaries were published for larger cities in the state as well, but as retail trade has become more concentrated the publication of city-level statistics was ended. Furthermore, for many of the smaller counties statistics for some of the business groups are now being suppressed to prevent the revealing of confidential information.
Additional Background on Sales and Use Taxes
Simply stated, the distinction between sales tax and use tax reflects the location of where the transaction occurs. Purchases of tangible goods and services from vendors where the transaction occurs within the borders of Iowa are subject to the sales tax. Similar types of purchases made from vendors located outside of Iowa for use or consumption within Iowa are subject to the use tax. Some companies have both physical locations in Iowa and other facilities located outside the state from which they make sales into Iowa. Thus, some of their sales are subject to sales tax and other sales are subject to use tax. The statewide tax rates are the same and currently equal 6 percent.
One additional complication with the statistics involves how use taxes are remitted to the state. Historically, companies that have made remote sales to Iowa customers, but also have a physical presence in the state have collected use tax on remote sales to Iowa customers. The IowaDOR statistical reports classify these collections as Retailer’s Use Tax. Statewide collections of these taxes are reported by the twelve business groups. Until recently, out of state vendors that did not have physical nexus in Iowa could not be compelled to collect use tax from their Iowa customers. For these purchases the customer has been required to remit the tax owed to the State. The tax remitted for these purchases are labeled as Consumer’s Use Tax in the statistical reports and the amount is only reported in aggregate.
As a result of the Wayfair U.S. Supreme Court decision and recent state legislation, an increased number of remote vendors will be required to collect use tax on sales to Iowa customers. These changes may be expected to result in the decline of Consumer’s Use Tax and an increase in Retailer’s Use Tax in future quarters. Additionally, new state regulations will require some remote vendors to register for sales tax permits rather than use tax permits. This will result in a further realignment of statistics. Thus, historical comparisons may be difficult for the next two to three years. Even though many of the law changes affecting sales and use taxes did not become effective until January 1, 2019, as will be noted in the discussion of the recently released 2018 fourth quarter statistics, some realignment of reported statistics appears to have already begun.
Aggregate Statewide Trends
During 2018, the amount of transactions subject to sales tax totaled $39.9 billion and an additional almost $9.1 billion in taxable sales from out-of-state vendors were subject to use tax. Since 2010 the cumulative change in taxable sales by Iowa vendors increased by 22.8%, but after adjusting for inflation the change equaled only 6.7%. On the other hand, taxable sales from out-of-state vendors increased by 57.0% in nominal dollars and by 36.3% after adjusting for inflation since 2010. The differences between taxable sales by vendors subject to sales and use taxes almost certainly reflect the rising importance of ecommerce. These trends are illustrated in the following charts.
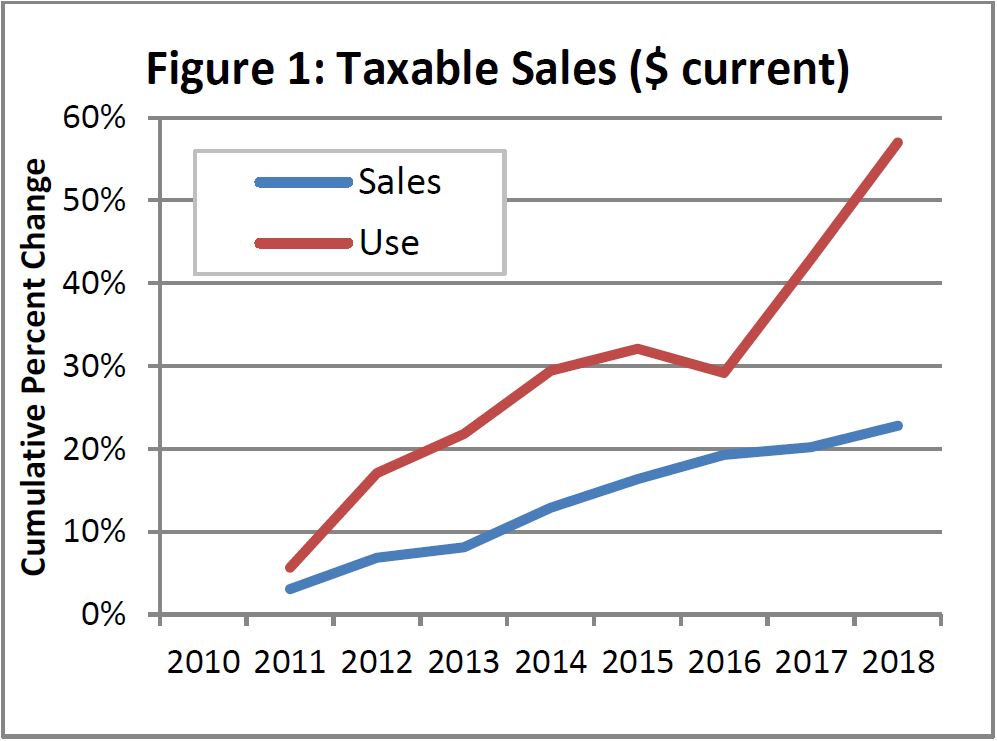
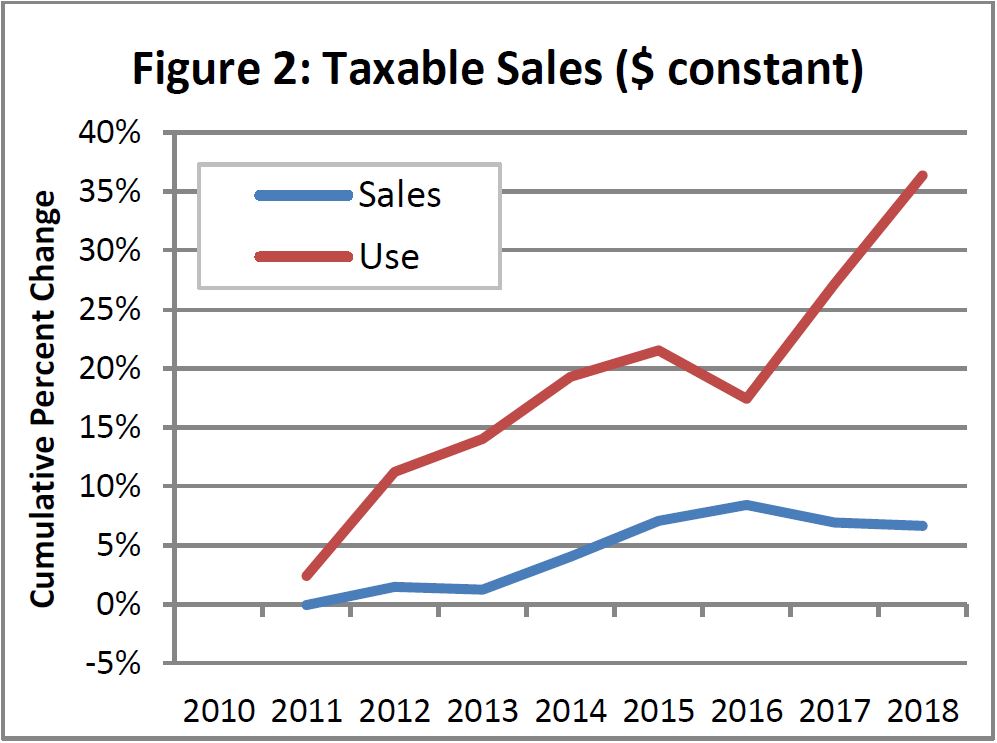
Both charts contain two similar interesting features. The dip in taxable sales for out-of-state vendors that occurred during 2016 corresponds in time with the exemption enacted for manufacturing consumables, such a lubricants, cleaning supplies, replacement parts, etc. The following steep growth in taxable sales by out-of-state vendors during 2017 and 2018 occurred as ecommerce companies started to collect Iowa use tax. Amazon began doing so in early 2017 on its own sales. Then following the U.S. Supreme Court’s Wayfair decision in June 2018 other companies began to collect and remit Iowa use tax. With the expansion of Iowa sales and use tax to many other ecommerce vendors effective January 1, 2019 a further significant jump in taxable sales can be expected when first quarter 2019 statistics are released. Further discussion of the impact of ecommerce on Iowa will be provided in a future report.
Turning to nominal taxable sales for in-state vendors the left-hand chart shows modest and relatively steady growth over the entire period since 2010. But, when adjusted for inflation taxable sales by in-state vendors show no growth since 2015. This is particularly important for Iowa because this means that retail businesses with physical locations in Iowa are showing no growth.
Statewide Taxable Sales by Business Group
Because tax rates have changed over time it is best to analyze retail trade trends on the basis of taxable sales rather than based on the amount of tax collected. Until recently the IowaDOR did not publish taxable sales amounts in their statewide summary tables, but close estimates can be made by applying the tax rates in effect for each quarter to the computed tax figures provided in the tables.
As stated above, the IowaDOR each quarter publishes statewide aggregate statistics for Sales Tax, Retailer’s Use Tax, and Consumer’s Use Tax. However, the twelve business group breakouts of the statistics are only provided for Sales Tax and Retailer’s Use Tax. Because Consumer’s Use Tax accounts for only a small share of tax collections the lack of business group breakouts only causes a minor distortion for comparisons and trend analyses.
A greater distortion of historical statistics relates to the fact that many individuals have evaded reporting taxable purchases from out-of-state vendors. Because businesses are more likely to be audited than individuals, it is assumed they pay most of the Consumer’s Use Tax. As a result of the Wayfair decision and state legislation enacted during 2018 many remote vendors have begun collecting use tax from Iowa customers. This likely means the Consumer’s Use Tax category of payments may largely disappear in the future. During 2018 the shares of total sales and use tax accounted for by Sales Tax equaled 81.5%; by Retailer’s Use Tax, 15.8%; and by Consumer’s Use Tax, 2.7%.
The following table (Table 1) presents taxable sales by quarter and for all of calendar year 2018 made by businesses located in Iowa (i.e., sales tax permit holders). In addition, the table shows the breakout of taxable sales by twelve major business groups and the percentages of total calendar year taxable sales by each business group. A similar table (Table 2) presents taxable sales statistics for 2018 for out-of-state vendors that file Retailer’s Use Tax returns.
Annual (fiscal year) Iowa Sales and Use Tax Statistical Reports published by the IowaDOR provide information in MS Excel tables that identify the composition of each of the twelve major business groups into which the statistics are aggregated. The annual reports may be found at https://tax.iowa.gov/report/Annual.
Table 1: 2018 Taxable Sales by Sales Tax Permit Holders
| Business Group | Quarter 1 | Quarter 2 | Quarter 3 | Quarter 4 | CY Total | CY Shares |
|---|---|---|---|---|---|---|
| Apparel | $209,432,795 | $239,634,759 | $249,007,834 | $290,216,871 | $988,292,259 | 2.48% |
| Building Materials | $554,516,928 | $867,950,665 | $785,798,462 | $706,314,905 | $2,914,580,960 | 7.31% |
| Eating and Drinking | $1,037,580,558 | $1,151,168,360 | $1,167,814,569 | $1,110,895,134 | $4,467,458,621 | 11.20% |
| Food Dealers | $802,137,514 | $912,609,991 | $960,193,275 | $916,843,896 | $3,591,784,676 | 9.01% |
| General Merchandise | $1,046,271,991 | $1,166,655,565 | $1,134,672,598 | $1,346,797,285 | $4,694,397,439 | 11.77% |
| Home Furnishings | $279,018,500 | $292,585,920 | $291,213,640 | $337,466,719 | $1,200,284,779 | 3.01% |
| Miscellaneous | $560,243,967 | $895,238,920 | $962,531,191 | $881,130,951 | $3,299,145,029 | 8.27% |
| Motor Vehicle | $445,944,570 | $545,795,189 | $524,315,053 | $489,083,900 | $2,005,138,712 | 5.03% |
| Services | $1,257,266,210 | $1,482,559,033 | $1,518,991,034 | $1,429,323,904 | $5,688,140,180 | 14.27% |
| Specialty Retail | $665,441,865 | $753,203,088 | $745,363,404 | $894,569,451 | $3,058,577,808 | 7.67% |
| Utilities and Transportation | $977,434,891 | $960,586,344 | $1,065,905,474 | $986,732,836 | $3,990,659,545 | 10.01% |
| Wholesale | $822,152,743 | $1,051,319,390 | $1,068,173,560 | $1,031,754,189 | $3,973,399,882 | 9.97% |
| Total Taxable Sales | $8,657,442,532 | $10,319,307,224 | $10,473,980,094 | $10,421,130,041 | $39,871,859,890 | 100.00% |
Table 2: 2018 Taxable Sales by Use Tax Permit Holders
| Business Group | Quarter 1 | Quarter 2 | Quarter 3 | Quarter 4 | CY Total | CY Shares |
|---|---|---|---|---|---|---|
| Apparel | $35,155,325 | $32,566,441 | $36,796,451 | $64,506,940 | $169,025,157 | 2.19% |
| Building Materials | $27,455,471 | $45,130,386 | $48,608,671 | $45,981,345 | $167,175,873 | 2.16% |
| Eating and Drinking | $3,183,389 | $4,177,325 | $5,624,503 | $3,908,892 | $16,894,109 | 0.22% |
| Food Dealers | $13,576,076 | $13,928,108 | $14,496,632 | $18,120,514 | $60,121,330 | 0.78% |
| General Merchandise | $17,129,500 | $17,847,444 | $17,614,577 | $23,122,275 | $75,713,796 | 0.98% |
| Home Furnishings | $26,925,011 | $31,932,113 | $28,439,300 | $36,676,217 | $123,972,641 | 1.60% |
| Miscellaneous | $261,616,971 | $323,818,123 | $302,396,338 | $381,143,372 | $1,268,974,804 | 16.42% |
| Motor Vehicle | $10,055,539 | $14,772,275 | $14,067,688 | $15,477,232 | $54,372,734 | 0.70% |
| Services | $258,723,816 | $303,363,531 | $310,124,558 | $688,388,427 | $1,560,600,332 | 20.20% |
| Specialty Retail | $385,570,399 | $416,143,627 | $434,849,640 | $609,563,851 | $1,846,127,517 | 23.89% |
| Utilities and Transportation | $312,951,770 | $256,194,018 | $319,928,504 | $318,525,971 | $1,207,600,263 | 15.63 |
| Wholesale | $253,625,951 | $302,161,700 | $319,083,597 | $301,199,459 | $1,176,070,707 | 15.22% |
| Total Taxable Sales | $1,605,969,218 | $1,762,035,091 | $1,852,030,459 | $2,506,614,495 | $7,726,649,263 | 100.00% |
The calendar year shares for the twelve business groups reveal some notable differences between taxable sales by in-state and out-of-state vendors. For example, there is no surprise that while eating and drinking establishments account for 11.20% of taxable sales by in-state vendors, this business group accounts for only 0.22% of total taxable sales by out-of-state vendors. On the flip side, specialty retailers account for 23.89% of total taxable sales to Iowa customers by out-of-state vendor, but for only 7.67% of total taxable sales by in-state vendors. The likely explanation for this difference is because the specialty retail group includes electronic and other direct retailers.
Changes in Taxable Sales from 2017 to 2018
Figure 3 shows the year-to-year percent change by quarter between 2017 and 2018 of total taxable sales by in-state (Sales), out-of-state (Use), and for all vendors combined. For the entire year the percent change for in-state vendors equaled 2.16% with the greatest change occurring during the third quarter (3.28%). For out-of-state vendors the full year change equaled 10.91% with the greatest change occurring during the fourth quarter (22.65%)
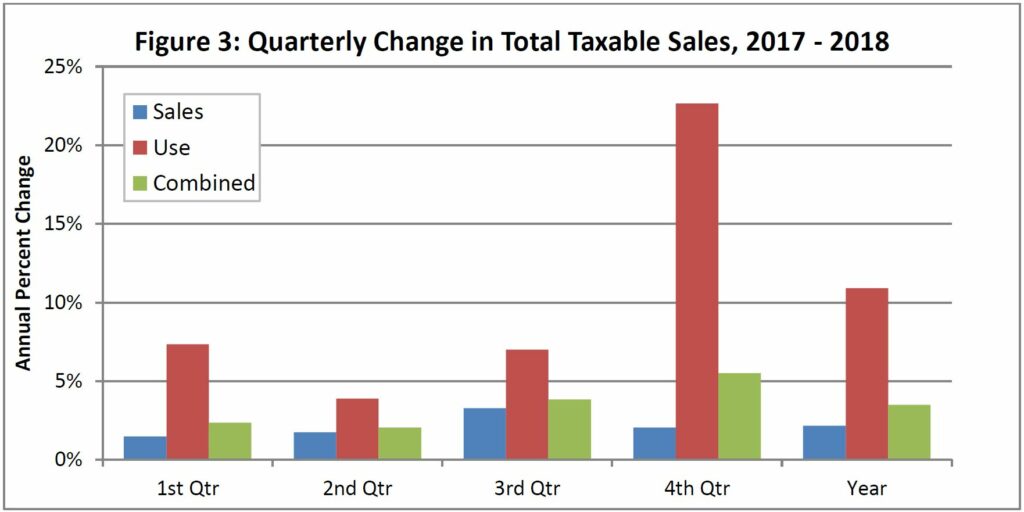
Figure 4 shows the year-to-year percent changes in taxable sales by business group between 2017 and 2018 for in-state vendors (Sales) and for out-of-state vendors (Use). There are stark differences among the business groups between taxable sales by in-state and out-of-state vendors. One of the most noticeable differences involves the services business group. Quarterly statistics highlight a dramatic change for out-of-state businesses in this group. Notably first quarter 2018 growth over first quarter 2017 equaled only 1.18%. Second quarter the growth rate increased to 7.51%, then third quarter to 11.67%, and finally fourth quarter there was an extraordinary 100.82% jump. The likely explanation for this large growth in taxable sales by out-of-state service businesses to Iowa customers is legislation enacted last year that made sales of digitally delivered goods and subscription and pay television services, such as streaming video, video on-demand, and pay-per-view, subject to sales and use taxes effective May 30, 2018.
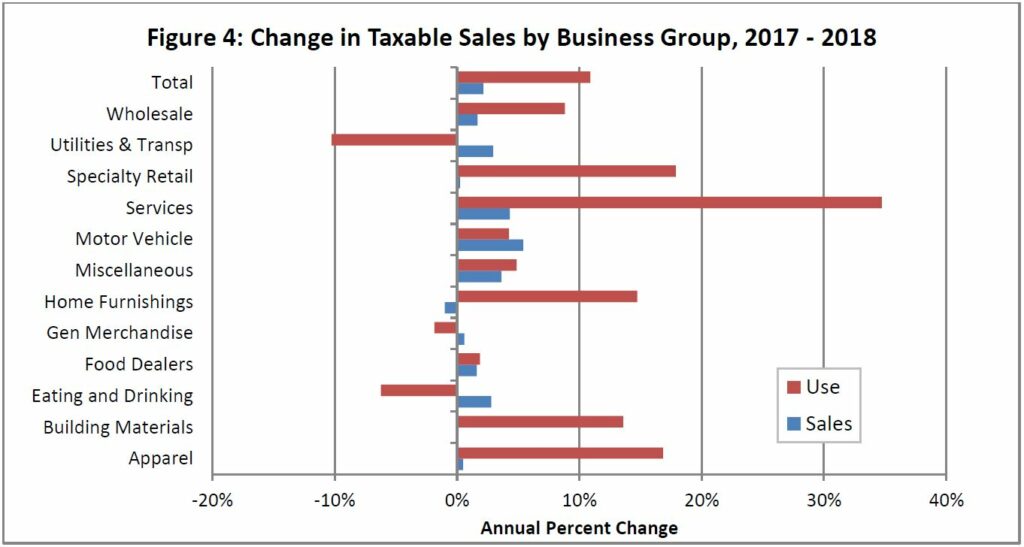
There are considerable differences between taxable sales by in-state and out-of-state vendor for many of the other business groups as well. Changes in the tax treatment of ecommerce likely explains some of these differences, but probably not for all of the business groups. For example, the specialty retail group includes many direct and ecommerce vendors. Consequently, taxable sales by out-of-vendors jumped by 17.89%, while taxable sales growth for in-state vendors in this group increased by a meager 0.25%. Similarly, for businesses in the home furnishings group out-of-state taxable sales jumped by 14.74%, while for in-state taxable sales declined by 0.99%.
On the other hand, the 13.57% growth in taxable sales for out-of-state building materials vendors compared to only 0.03% taxable sales growth for in-state vendors in this business group may more likely reflect the needs for special types of materials for some major construction projects going on in Iowa last year.
For still other business groups the comparisons between taxable sales by in-state and out-of-state vendors may hold little meaning due to the obsolete assignment of business codes to some businesses. For example, for the general merchandise group taxable sales by in-state vendors grew by 0.61% last year, while taxable sales by out-of-state vendors declined by 1.84%. However, this difference is distorted because Amazon, the Wal-Mart of the Internet, is classified generically as an electronic shopping and mail order house rather than as a general merchandise business.
Changes in Taxable Sales from 2010 to 2018
Figure 5 shows the cumulative percent changes in taxable sales between 2010 and 2018 by business group for in-state (Sales) and out-of-state (Use) vendors. Over these eight years taxable sales by in-state vendors grew by 22.82%, while for out-of-state vendors taxable sales growth equaled 60.51%. Over this period consumer prices (CPI) increased by 16.44% and Iowa personal income grew by 32.43%
There are four business groups for which in-state vendors experienced higher growth rates than did out-of-state vendors. These groups are wholesale, utilities and transportation, food dealers, and eating and drinking establishments.
There are three likely reasons in-state vendors within these four business categories had sales that outpaced the growth of out-of-state vendors. First, they provide perishable goods that consumers desire to consume immediately, such as is the case for bars and restaurants and grocery and convenience stores. Second, they provide goods or services that are needed immediately or within a specific location. This is often the case with goods provided by wholesalers and transportation companies. Third, as is the case with many utility service providers, such as water, electricity, and natural gas utilities, the service areas are tied to specific local geographies. One exception within the utilities and transportation group is communications services, which increasingly are being provided by national companies and becoming less tied to local monopolies. Also, the reclassification of convenience stores that sell motor fuel from the motor vehicle to food dealers group during the third quarter of 2013 contributed to the growth of the later group’s taxable sales.
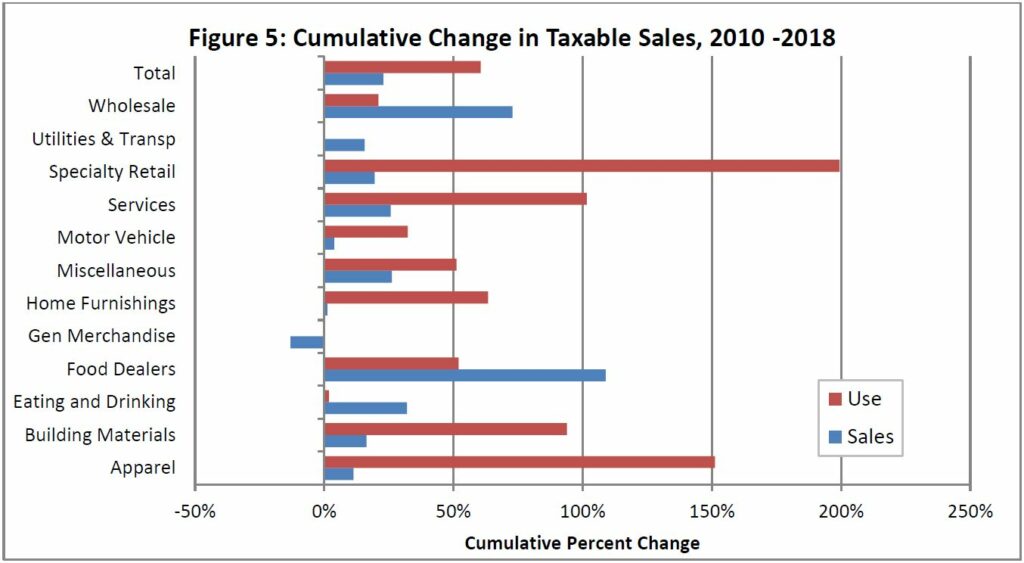
The business groups for which out-of-state vendors had taxable sales growth rates significantly higher than did in-state vendors over the eight years are specialty retail, apparel, services, and building materials. As stated previously the U.S. Supreme Court’s Wayfair decision and state legislation enacted last year that extends sales and use taxes to many types of ecommerce activities has significantly boosted and will likely continue to boost the amount of out-of-state sales subject to Iowa taxes over the next year. Many of the ecommerce companies and other remote sellers fall within the specialty retail, apparel, and services business groups. Out-of-state sales growth for the building materials group is likely due to other factors. For example, many of the materials and components installed in several large data centers in the Des Moines area and elsewhere in the state are acquired from out-of-state suppliers. The same is true for much of the equipment used to construct wind turbines and to upgrade electric transmission lines in the state.
The capture of larger shares of certain types of retail trade by ecommerce companies has impacts similar to those caused by the rise of big box stores and shopping malls several decades ago. Those earlier changes left many downtown and Main Street shopping districts hollowed out. Also, the control and profits of many types of business moved from being local to national chains. Those earlier changes saw many jobs migrate from downtown areas to suburbs and to the outer edges of small towns. Now, the rise of ecommerce has caused a regional shift of retail employment and profits to a small number of technology hubs, such as Seattle and San Francisco. Figure 6 shows the trade sectors being most and least affected by the rise of ecommerce.
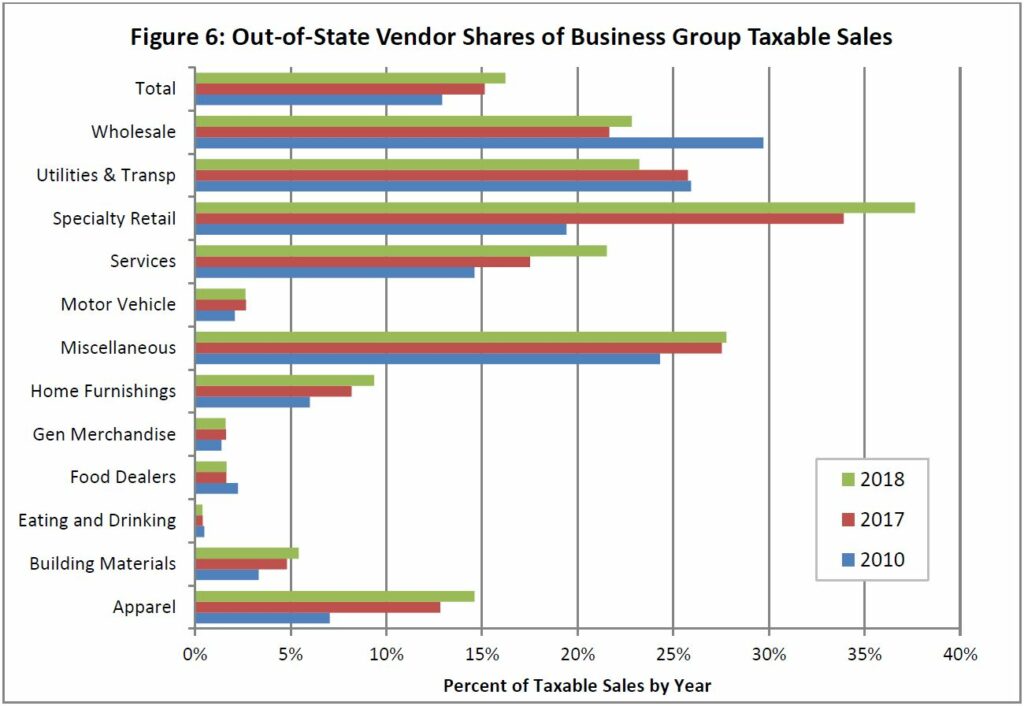
The share of specialty retail taxable sales by out-of-state vendors has almost doubled in just eight years from 19.41% to 37.64%. The out-of-state share of sales for the apparel group has over doubled from 7.04% to 14.60%. For the services group the out-of-state vendor share increased from 14.61% to 21.53%.
The business groups in which out-of-state vendors have seen little or no share growth over the past eight years are eating and drinking places, food dealers, general merchandise, and motor vehicle. Out-of-state vendors have captured less than 3 percent of taxable sales within any of these four business growths. There are likely a variety of reasons that businesses in these groups have not experienced much loss of sales to ecommerce and other remote sellers.
Eating and drinking places provide local entertainment and experiences as well as perishable products. Packaged meal online offerings likely have not yet caught on much in Iowa and much of what groceries and convenience stores sell are perishable both in a physical and practical sense. As stated previously ecommerce companies that sell products comparable to those sold by department, discount, and variety stores are classified in the specialty retail business group rather than the general merchandise group. So at least to some extent the apparent lack of inroads by out-of-state vendors into the general merchandise area is a statistical aberration. But in addition, many of the big box retailers have their own ecommerce sites and sales through these sites are included on statistical reports as in-state sales. In Iowa the actual sales of motor vehicles are not subject to sales or use tax. The transactions by businesses in the motor vehicle group that are subject to sales and use taxes include parts and accessories and maintenance and repair services provided by motor vehicle dealers. These are the type of purchases that consumers desire or need to make from local vendors.
Concluding Comments
Finally, Figure 7 shows that for most of the twelve business groups there has been little change in the shares of total taxable sales accounted for by each group.
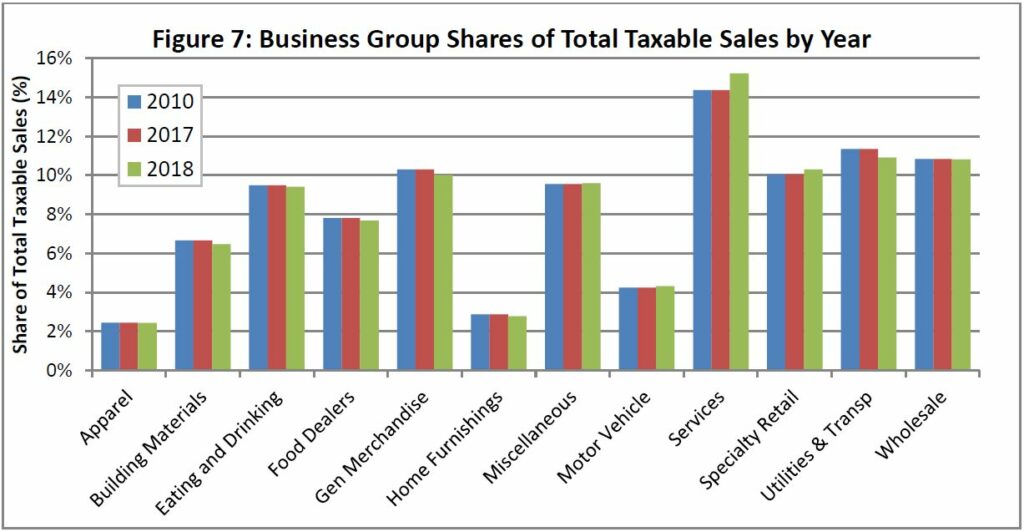
Over the eight years there has been a small amount of growth for the services group, but this is a continuation of a trend that dates back several decades. Also, the increase from 14.37% to 15.23% of total taxable sales may reflect some law changes that have modified the list of enumerated services subject to sales and use taxes in Iowa. Due changes enacted during 2018 and that took effect January 1, 2019 the services share of total taxable sales is likely to show more increase this year.
The share of taxable sales accounted for by businesses in the specialty retail group only increased from 10.04% to 10.30%. As already pointed out this is the group that includes sales by a large share of ecommerce companies. So, this group’s share of sales is likely to increase further during 2019.
The share of taxable sales accounted for by the general merchandise group declined from 10.31% during 2010 to 10.02% during 2018. The entire decline occurred between 2017 and 2018. This was the year during which Sears and Younkers closed all of their Iowa stores.
The share of taxable sales accounted for by the utilities and transportation group decreased from 11.35% to 10.92% over the eight years. It appears that most of the decrease can be attributed to communications utilities. One possible explanation is less than half of homes have land line telephone service any longer. Nationwide, this is particularly true to people ages 18 to 24 with only 35.8% having land line phones. Alternatively, for people ages 65 and older the share with land line phones equals 76.1%. This trend is likely to continue.
Finally, with the law changes that took effect on January 1st of the current year are likely to represent a major transition for the taxable sales balance between in-state and out-of-state vendors. The continued growth of Internet based services and changing consumption preferences between goods and services among different age cohorts of consumers will further contribute to the relative importance of difference business groups within the economy.
Additional analysis of the impacts of changes in state laws related to ecommerce and analysis of differences in retail and taxable services activities among Iowa’s metropolitan, micropolitan, and rural counties will be addressed in future newsletters.