Iowa’s unemployment rate during March remained at 2.4%, the same rate that has persisted since last July. North Dakota and Vermont had unemployment rates of 2.3% and New Hampshire tied Iowa at 2.4%. Alaska, at 6.5%, had the highest state unemployment rate. Nationally, the unemployment rate remained at 3.8%.
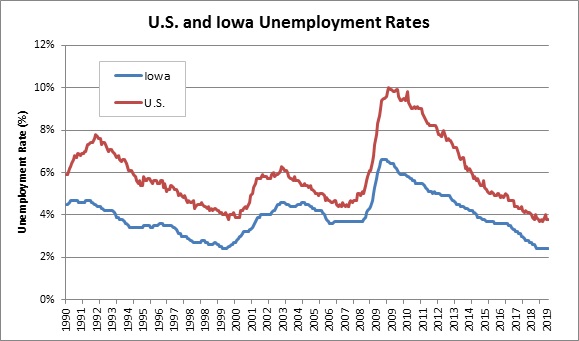
The following chart shows Iowa and national unemployment rates from the beginning of 1990 through March 2019. As the chart shows, Iowa’s unemployment rate falls consistently below the national rate. During the last recession the national unemployment rate peaked at 10.0% during October 2009, while Iowa’s unemployment rate peaked at 6.6% during the months of May through August 2009.
The last time Iowa’s unemployment rate fell to 2.4%, which was during the months of December 1999 through March 2000 the national unemployment rate ranged between 4.0% and 4.1%. So, the current spread between the Iowa and national rates is slightly larger than at that time. It is noteworthy that by March 2001 the nation fell into recession following which the national and Iowa unemployment rates peaked during June 2003 at 6.3% and 4.6%, respectively.
Iowa’s March employment report reveals some interesting differences between the household and payroll survey results. The household survey indicates that total employment increased by 5,400 between February and March, while the payroll survey reported a loss of 2,700 jobs. Year-over-year the household survey indicates that employment increased by 28,000, while the payroll survey identified only 3,900 new jobs.
The following chart shows the difference between the employment counts derived from the household and payroll surveys by month since the beginning of 1990. The household counts exceed the payroll counts due to differences in how the two surveys count employment. The household survey counts the number of people who are employed, while the payroll survey counts the number of jobs. This difference would seem to imply that the payroll employment count should exceed the household employment count. However, the household survey has much broader coverage. The payroll survey counts only nonfarm wage and salary workers. The household survey counts payroll workers as well as agricultural workers, the self-employed, workers in private households, unpaid family workers, and workers on unpaid leaves.
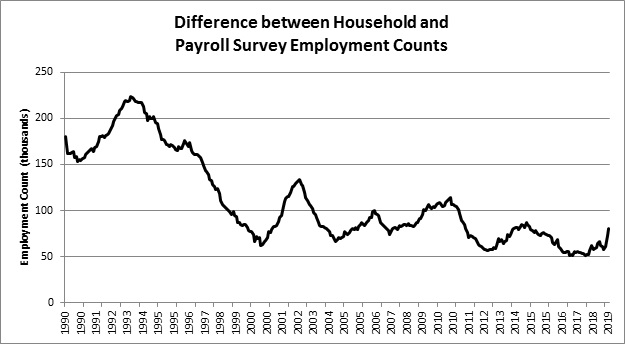
The above chart shows fluctuations that vary with expansions and contractions of the state’s economy as well as a long-term downward trend. For each cycle of the chart the difference between the two employment counts appears to hit bottom from six months to a year prior to the beginning of a recession and peaks six months to a year after a recession ends. Also, as the chart shows, the difference between the two employment counts experiences minor cycles in between recessions.
Since the end of 2017 the difference between the household and payroll surveys employment counts has increased from 51,100 to 81,000, which equals 29,900 (58.5%). Given the difficulty many businesses claim to be having to attract workers one would expect the difference to be declining rather than growing. This is a sign that Iowa’s economic growth may be peaking. Future postings will address other signs.